

v0.1.0 Sep 2024 7 min 53 3 0
Market Heatmap: A Terminal-Style Dashboard Without the Frameworks
v0.1.0 Sep 2024 7 min
53 3 0
Core Mechanics: Pipeline and Performance
The whole app runs as plain ES modules from index.html. No build step, no Vite config, no JSX transform. This was deliberate: I wanted to trace every update from data arrival to paint without black boxes in between.
The mental model is a unidirectional pipeline: Transport pushes data to StateManager, which flags tiles as “dirty”. The UpdateScheduler then creates a batch and paints all changes in a single requestAnimationFrame loop. Crucially, a TileRegistry caches all DOM lookups at initialization, ensuring that the render loop never wastes cycles querying document.getElementById during high-frequency updates.
This separation forces discipline. The renderer never reads from the DOM during a write (preventing layout thrashing) and sparkline canvases use a ring buffer pattern to push pixel data efficiently without constant array allocations. It proves that with strict architecture, raw DOM manipulation is still the performance ceiling.
Data Strategy: Simulation and Reality
The system is designed to handle two distinct realities with the same frontend code:
-
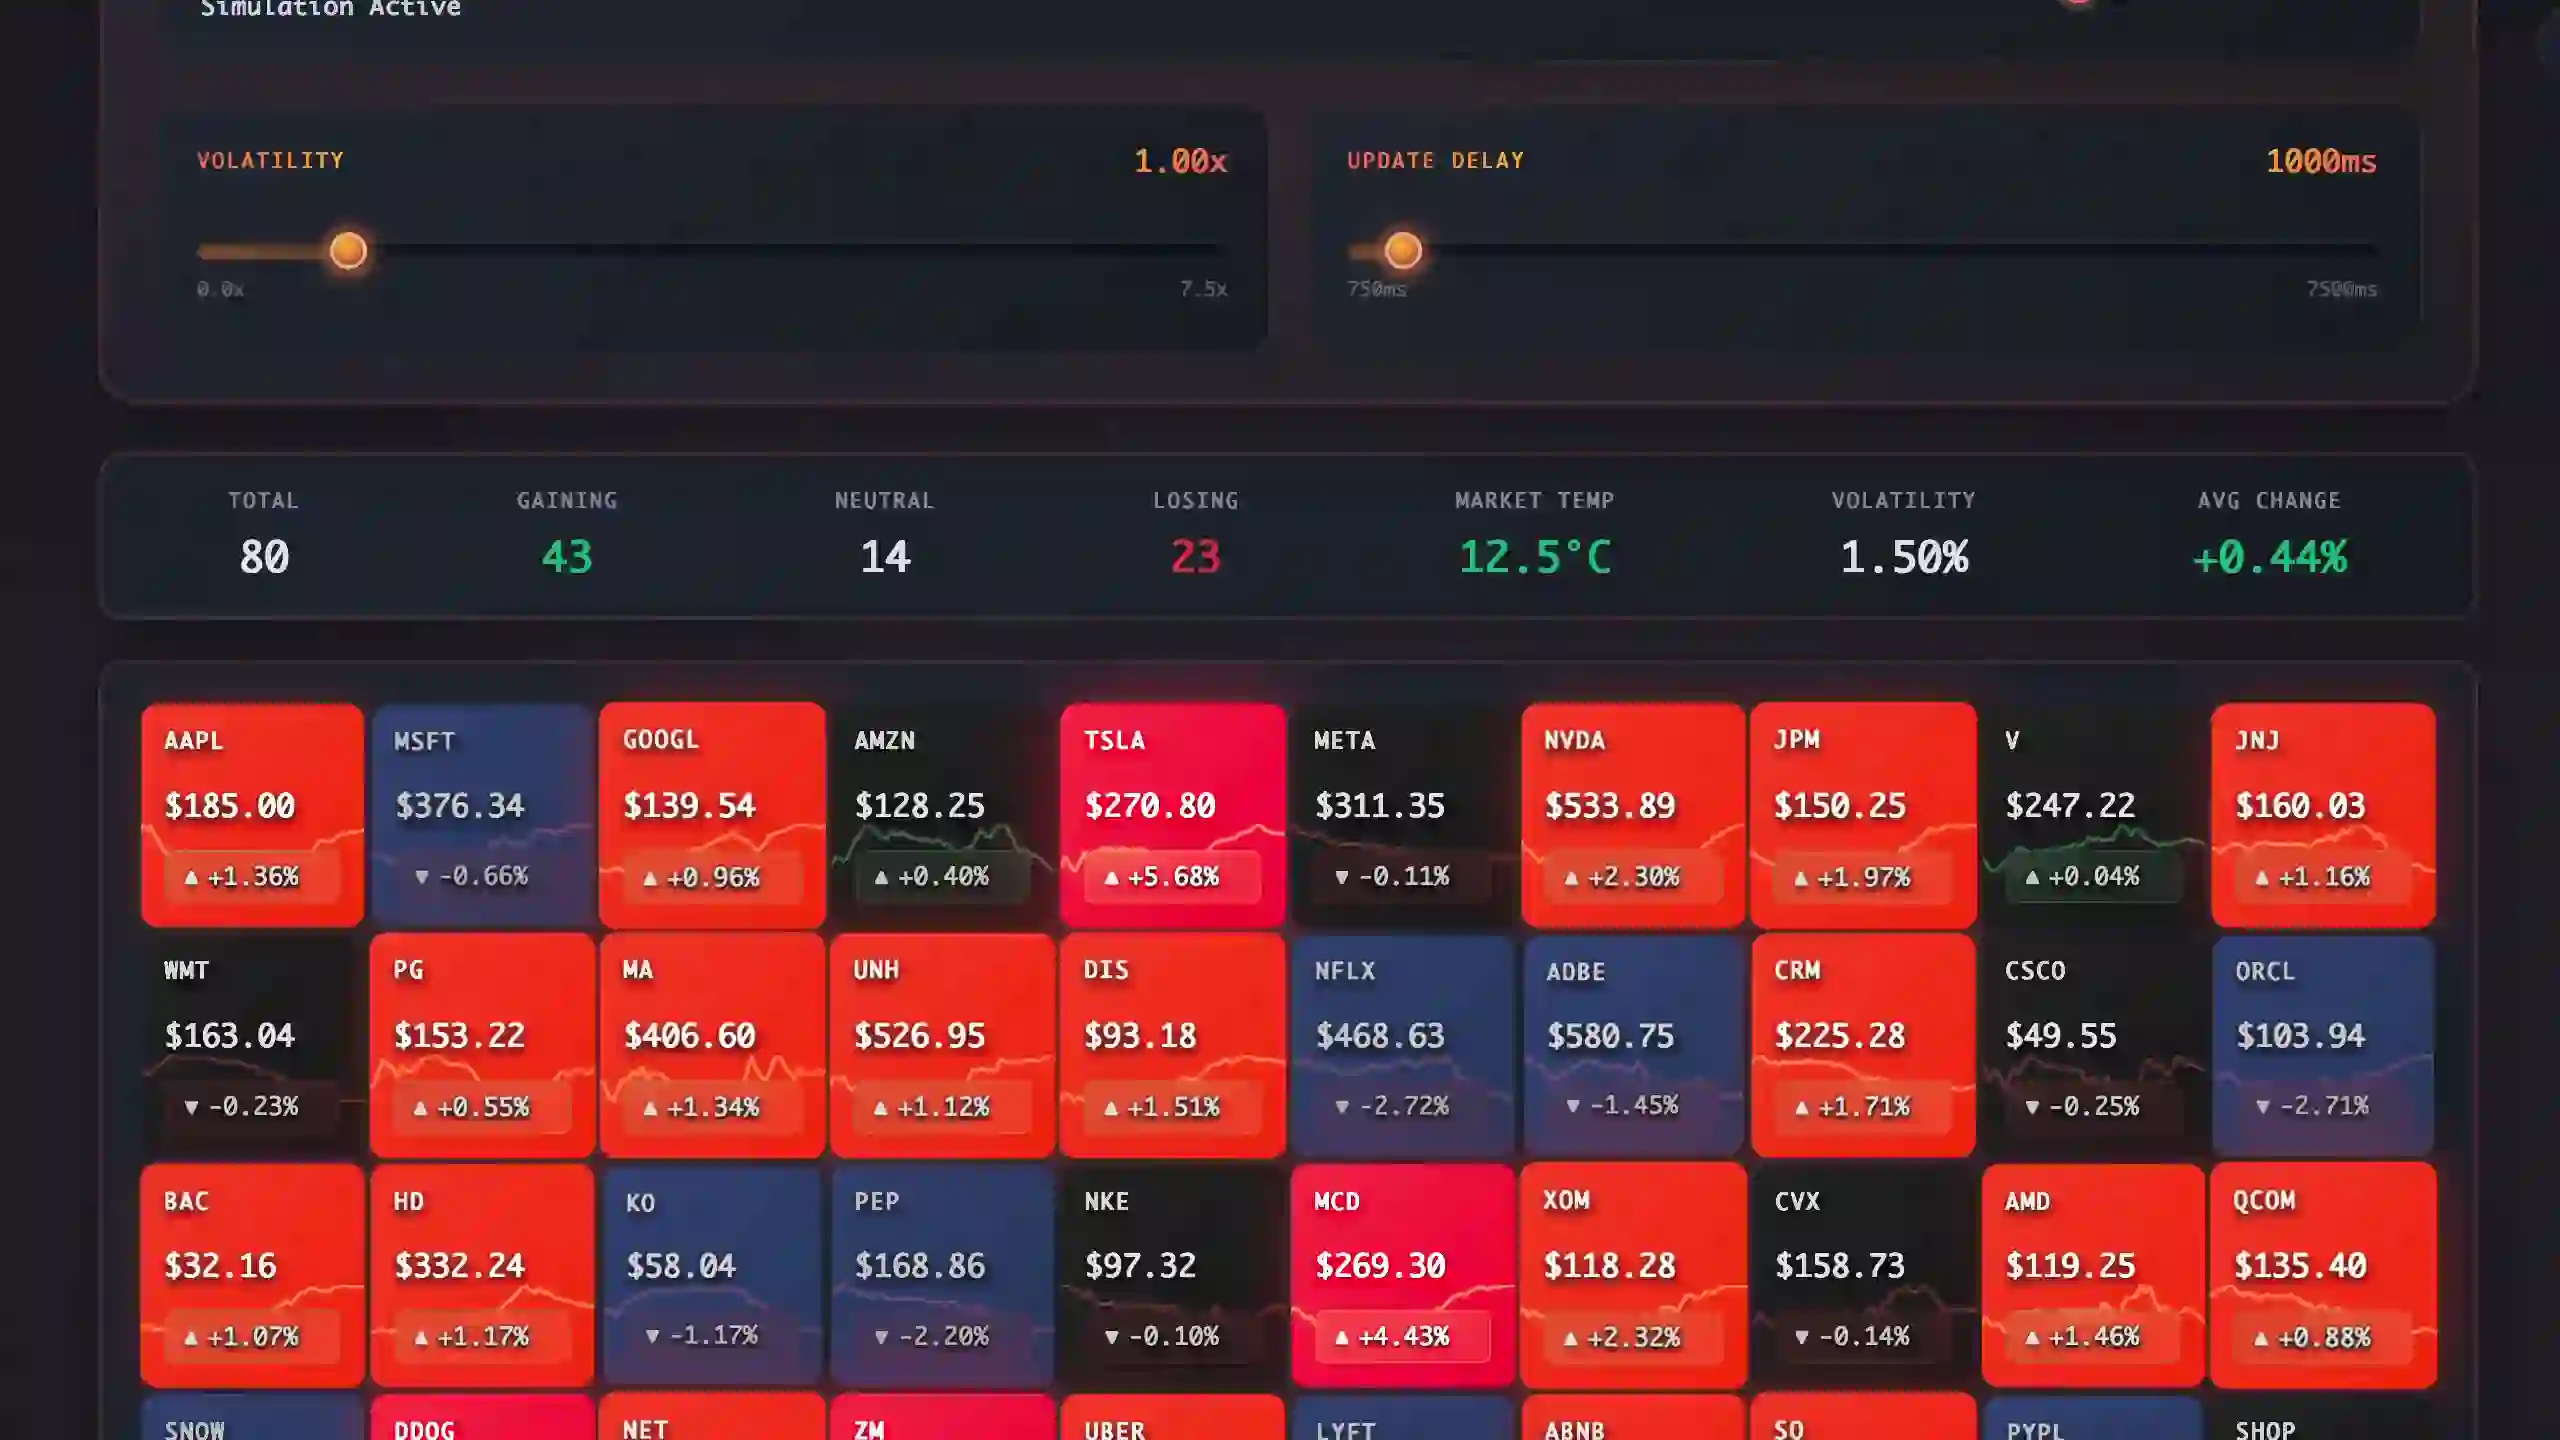
Simulation Mode generates sine-wave price movements with layered noise to mimic the fractal nature of real markets. It’s not just a placeholder; it’s a deterministic stress-test environment where I can crank up volatility and profile the renderer without network jitter.
-
Real Mode connects to Finnhub, but not directly. A custom Express proxy (
proxy/server.js) sits in the middle to fan out WebSocket connections and enforce rate limits. It handles connection multiplexing: if you open five tabs, they share a single upstream WebSocket connection, preventing you from hitting the API provider’s concurrency limits. This keeps API keys out of the browser and sanitizes the data stream before it touches the UI.
Design System & Learnings
The trading terminal aesthetic isn’t just styling; it’s a constraint. To make a dense grid read clearly, I relied heavily on CSS variables for themes and cubic-bezier transitions that feel snappy rather than floaty. Layouts use grid-template-columns: repeat(auto-fill, ...) to flow naturally across any screen size without media-query soup.
Building this way highlighted that explicit state beats reactive magic when you need to understand exactly when an update happens. Batching isn’t optional at this density; the difference between a smooth 60fps and a janky experience is often just grouping read/write operations. This project is a sandbox for pushing UI performance, proving that complex, data-heavy interfaces don’t strictly require a heavy framework to feel professional.
This project note was last updated on December 12, 2025 and refers to project version v0.1.0.
Comments (0)
No comments yet. Be the first to share your thoughts!